트레이딩뷰 파인스크립트 RSI 알람 질문이요
-
게시물 수정 , 삭제는 로그인 필요
아래에 있는 것은
트레이딩뷰 RSI 기본 지표에 대한 파인스크립트인데요.
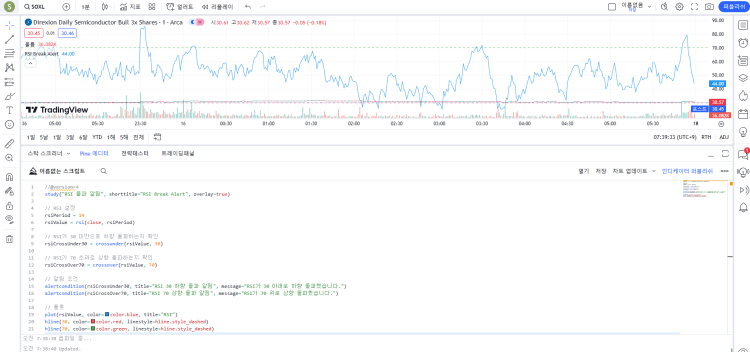
여기서 저는 RSI 지수가 30 밑으로 돌파할 때와 70 위로 돌파할 때 알람이 울리게 설정을 하고 싶은데
파인스크립트 코드로 어떻게 만들 수 있나요?
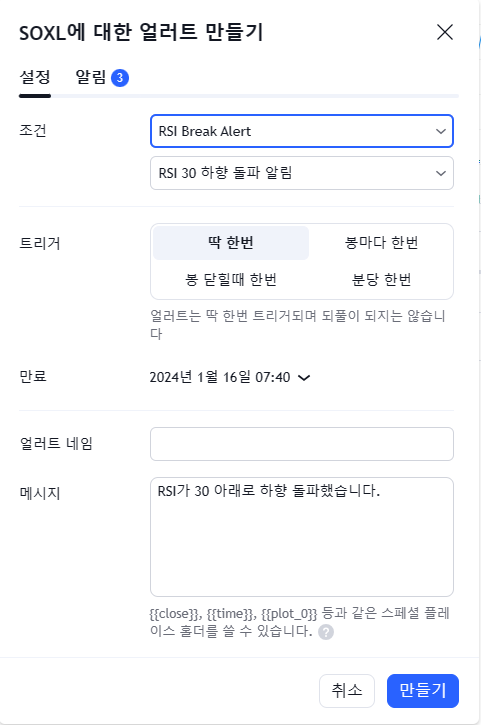
참고로 중요한건 RSI 지수가 30 밑으로 혹은 70 위로 돌파할 때 1번만 알람이 울리게 설정하는 법이 궁금합니다.
예를 들어서 '< 30 ' 이런 식으로 코드를 짜면
30 밑으로 돌파할 때 1번만 알람이 울리는게 아니라
다음 캔들에서 29일 떄 울리고
그 다음 캔들에서 28일 때 또 울리고
이런게 싫어서 그냥 돌파할 때 1번만 울리게 설정하고 싶습니다.
//@version=5
indicator(title="Relative Strength Index", shorttitle="RSI", format=format.price, precision=2, timeframe="", timeframe_gaps=true)
ma(source, length, type) =>
switch type
"SMA" => ta.sma(source, length)
"Bollinger Bands" => ta.sma(source, length)
"EMA" => ta.ema(source, length)
"SMMA (RMA)" => ta.rma(source, length)
"WMA" => ta.wma(source, length)
"VWMA" => ta.vwma(source, length)
rsiLengthInput = input.int(14, minval=1, title="RSI Length", group="RSI Settings")
rsiSourceInput = input.source(close, "Source", group="RSI Settings")
maTypeInput = input.string("SMA", title="MA Type", options=["SMA", "Bollinger Bands", "EMA", "SMMA (RMA)", "WMA", "VWMA"], group="MA Settings")
maLengthInput = input.int(14, title="MA Length", group="MA Settings")
bbMultInput = input.float(2.0, minval=0.001, maxval=50, title="BB StdDev", group="MA Settings")
showDivergence = input.bool(false, title="Show Divergence", group="RSI Settings")
up = ta.rma(math.max(ta.change(rsiSourceInput), 0), rsiLengthInput)
down = ta.rma(-math.min(ta.change(rsiSourceInput), 0), rsiLengthInput)
rsi = down == 0 ? 100 : up == 0 ? 0 : 100 - (100 / (1 + up / down))
rsiMA = ma(rsi, maLengthInput, maTypeInput)
isBB = maTypeInput == "Bollinger Bands"
rsiPlot = plot(rsi, "RSI", color=#7E57C2)
plot(rsiMA, "RSI-based MA", color=color.yellow)
rsiUpperBand = hline(70, "RSI Upper Band", color=#787B86)
midline = hline(50, "RSI Middle Band", color=color.new(#787B86, 50))
rsiLowerBand = hline(30, "RSI Lower Band", color=#787B86)
fill(rsiUpperBand, rsiLowerBand, color=color.rgb(126, 87, 194, 90), title="RSI Background Fill")
bbUpperBand = plot(isBB ? rsiMA + ta.stdev(rsi, maLengthInput) * bbMultInput : na, title = "Upper Bollinger Band", color=color.green)
bbLowerBand = plot(isBB ? rsiMA - ta.stdev(rsi, maLengthInput) * bbMultInput : na, title = "Lower Bollinger Band", color=color.green)
fill(bbUpperBand, bbLowerBand, color= isBB ? color.new(color.green, 90) : na, title="Bollinger Bands Background Fill")
midLinePlot = plot(50, color = na, editable = false, display = display.none)
fill(rsiPlot, midLinePlot, 100, 70, top_color = color.new(color.green, 0), bottom_color = color.new(color.green, 100), title = "Overbought Gradient Fill")
fill(rsiPlot, midLinePlot, 30, 0, top_color = color.new(color.red, 100), bottom_color = color.new(color.red, 0), title = "Oversold Gradient Fill")
// Divergence
lookbackRight = 5
lookbackLeft = 5
rangeUpper = 60
rangeLower = 5
bearColor = color.red
bullColor = color.green
textColor = color.white
noneColor = color.new(color.white, 100)
plFound = na(ta.pivotlow(rsi, lookbackLeft, lookbackRight)) ? false : true
phFound = na(ta.pivothigh(rsi, lookbackLeft, lookbackRight)) ? false : true
_inRange(cond) =>
bars = ta.barssince(cond == true)
rangeLower <= bars and bars <= rangeUpper
//------------------------------------------------------------------------------
// Regular Bullish
// rsi: Higher Low
rsiHL = rsi[lookbackRight] > ta.valuewhen(plFound, rsi[lookbackRight], 1) and _inRange(plFound[1])
// Price: Lower Low
priceLL = low[lookbackRight] < ta.valuewhen(plFound, low[lookbackRight], 1)
bullCondAlert = priceLL and rsiHL and plFound
bullCond = showDivergence and bullCondAlert
plot(
plFound ? rsi[lookbackRight] : na,
offset=-lookbackRight,
title="Regular Bullish",
linewidth=2,
color=(bullCond ? bullColor : noneColor)
)
plotshape(
bullCond ? rsi[lookbackRight] : na,
offset=-lookbackRight,
title="Regular Bullish Label",
text=" Bull ",
style=shape.labelup,
location=location.absolute,
color=bullColor,
textcolor=textColor
)
//------------------------------------------------------------------------------
// Regular Bearish
// rsi: Lower High
rsiLH = rsi[lookbackRight] < ta.valuewhen(phFound, rsi[lookbackRight], 1) and _inRange(phFound[1])
// Price: Higher High
priceHH = high[lookbackRight] > ta.valuewhen(phFound, high[lookbackRight], 1)
bearCondAlert = priceHH and rsiLH and phFound
bearCond = showDivergence and bearCondAlert
plot(
phFound ? rsi[lookbackRight] : na,
offset=-lookbackRight,
title="Regular Bearish",
linewidth=2,
color=(bearCond ? bearColor : noneColor)
)
plotshape(
bearCond ? rsi[lookbackRight] : na,
offset=-lookbackRight,
title="Regular Bearish Label",
text=" Bear ",
style=shape.labeldown,
location=location.absolute,
color=bearColor,
textcolor=textColor
)
alertcondition(bullCondAlert, title='Regular Bullish Divergence', message="Found a new Regular Bullish Divergence, `Pivot Lookback Right` number of bars to the left of the current bar.")
alertcondition(bearCondAlert, title='Regular Bearish Divergence', message='Found a new Regular Bearish Divergence, `Pivot Lookback Right` number of bars to the left of the current bar.')
아래에 있는 것은
트레이딩뷰 RSI 기본 지표에 대한 파인스크립트인데요.
여기서 저는 RSI 지수가 30 밑으로 돌파할 때와 70 위로 돌파할 때 알람이 울리게 설정을 하고 싶은데
파인스크립트 코드로 어떻게 만들 수 있나요?
참고로 중요한건 RSI 지수가 30 밑으로 혹은 70 위로 돌파할 때 1번만 알람이 울리게 설정하는 법이 궁금합니다.
예를 들어서 '< 30 ' 이런 식으로 코드를 짜면
30 밑으로 돌파할 때 1번만 알람이 울리는게 아니라
다음 캔들에서 29일 떄 울리고
그 다음 캔들에서 28일 때 또 울리고
이런게 싫어서 그냥 돌파할 때 1번만 울리게 설정하고 싶습니다.
//@version=5
indicator(title="Relative Strength Index", shorttitle="RSI", format=format.price, precision=2, timeframe="", timeframe_gaps=true)
ma(source, length, type) =>
switch type
"SMA" => ta.sma(source, length)
"Bollinger Bands" => ta.sma(source, length)
"EMA" => ta.ema(source, length)
"SMMA (RMA)" => ta.rma(source, length)
"WMA" => ta.wma(source, length)
"VWMA" => ta.vwma(source, length)
rsiLengthInput = input.int(14, minval=1, title="RSI Length", group="RSI Settings")
rsiSourceInput = input.source(close, "Source", group="RSI Settings")
maTypeInput = input.string("SMA", title="MA Type", options=["SMA", "Bollinger Bands", "EMA", "SMMA (RMA)", "WMA", "VWMA"], group="MA Settings")
maLengthInput = input.int(14, title="MA Length", group="MA Settings")
bbMultInput = input.float(2.0, minval=0.001, maxval=50, title="BB StdDev", group="MA Settings")
showDivergence = input.bool(false, title="Show Divergence", group="RSI Settings")
up = ta.rma(math.max(ta.change(rsiSourceInput), 0), rsiLengthInput)
down = ta.rma(-math.min(ta.change(rsiSourceInput), 0), rsiLengthInput)
rsi = down == 0 ? 100 : up == 0 ? 0 : 100 - (100 / (1 + up / down))
rsiMA = ma(rsi, maLengthInput, maTypeInput)
isBB = maTypeInput == "Bollinger Bands"
rsiPlot = plot(rsi, "RSI", color=#7E57C2)
plot(rsiMA, "RSI-based MA", color=color.yellow)
rsiUpperBand = hline(70, "RSI Upper Band", color=#787B86)
midline = hline(50, "RSI Middle Band", color=color.new(#787B86, 50))
rsiLowerBand = hline(30, "RSI Lower Band", color=#787B86)
fill(rsiUpperBand, rsiLowerBand, color=color.rgb(126, 87, 194, 90), title="RSI Background Fill")
bbUpperBand = plot(isBB ? rsiMA + ta.stdev(rsi, maLengthInput) * bbMultInput : na, title = "Upper Bollinger Band", color=color.green)
bbLowerBand = plot(isBB ? rsiMA - ta.stdev(rsi, maLengthInput) * bbMultInput : na, title = "Lower Bollinger Band", color=color.green)
fill(bbUpperBand, bbLowerBand, color= isBB ? color.new(color.green, 90) : na, title="Bollinger Bands Background Fill")
midLinePlot = plot(50, color = na, editable = false, display = display.none)
fill(rsiPlot, midLinePlot, 100, 70, top_color = color.new(color.green, 0), bottom_color = color.new(color.green, 100), title = "Overbought Gradient Fill")
fill(rsiPlot, midLinePlot, 30, 0, top_color = color.new(color.red, 100), bottom_color = color.new(color.red, 0), title = "Oversold Gradient Fill")
// Divergence
lookbackRight = 5
lookbackLeft = 5
rangeUpper = 60
rangeLower = 5
bearColor = color.red
bullColor = color.green
textColor = color.white
noneColor = color.new(color.white, 100)
plFound = na(ta.pivotlow(rsi, lookbackLeft, lookbackRight)) ? false : true
phFound = na(ta.pivothigh(rsi, lookbackLeft, lookbackRight)) ? false : true
_inRange(cond) =>
bars = ta.barssince(cond == true)
rangeLower <= bars and bars <= rangeUpper
//------------------------------------------------------------------------------
// Regular Bullish
// rsi: Higher Low
rsiHL = rsi[lookbackRight] > ta.valuewhen(plFound, rsi[lookbackRight], 1) and _inRange(plFound[1])
// Price: Lower Low
priceLL = low[lookbackRight] < ta.valuewhen(plFound, low[lookbackRight], 1)
bullCondAlert = priceLL and rsiHL and plFound
bullCond = showDivergence and bullCondAlert
plot(
plFound ? rsi[lookbackRight] : na,
offset=-lookbackRight,
title="Regular Bullish",
linewidth=2,
color=(bullCond ? bullColor : noneColor)
)
plotshape(
bullCond ? rsi[lookbackRight] : na,
offset=-lookbackRight,
title="Regular Bullish Label",
text=" Bull ",
style=shape.labelup,
location=location.absolute,
color=bullColor,
textcolor=textColor
)
//------------------------------------------------------------------------------
// Regular Bearish
// rsi: Lower High
rsiLH = rsi[lookbackRight] < ta.valuewhen(phFound, rsi[lookbackRight], 1) and _inRange(phFound[1])
// Price: Higher High
priceHH = high[lookbackRight] > ta.valuewhen(phFound, high[lookbackRight], 1)
bearCondAlert = priceHH and rsiLH and phFound
bearCond = showDivergence and bearCondAlert
plot(
phFound ? rsi[lookbackRight] : na,
offset=-lookbackRight,
title="Regular Bearish",
linewidth=2,
color=(bearCond ? bearColor : noneColor)
)
plotshape(
bearCond ? rsi[lookbackRight] : na,
offset=-lookbackRight,
title="Regular Bearish Label",
text=" Bear ",
style=shape.labeldown,
location=location.absolute,
color=bearColor,
textcolor=textColor
)
alertcondition(bullCondAlert, title='Regular Bullish Divergence', message="Found a new Regular Bullish Divergence, `Pivot Lookback Right` number of bars to the left of the current bar.")
alertcondition(bearCondAlert, title='Regular Bearish Divergence', message='Found a new Regular Bearish Divergence, `Pivot Lookback Right` number of bars to the left of the current bar.')
#트레이딩뷰 파인스크립트 #트레이딩뷰 파인스크립트 강좌 #트레이딩뷰 파인스크립트 알람 #트레이딩뷰 파인스크립트 자동매매 #트레이딩뷰 파인스크립트 모바일